Greetings Future Scientists!
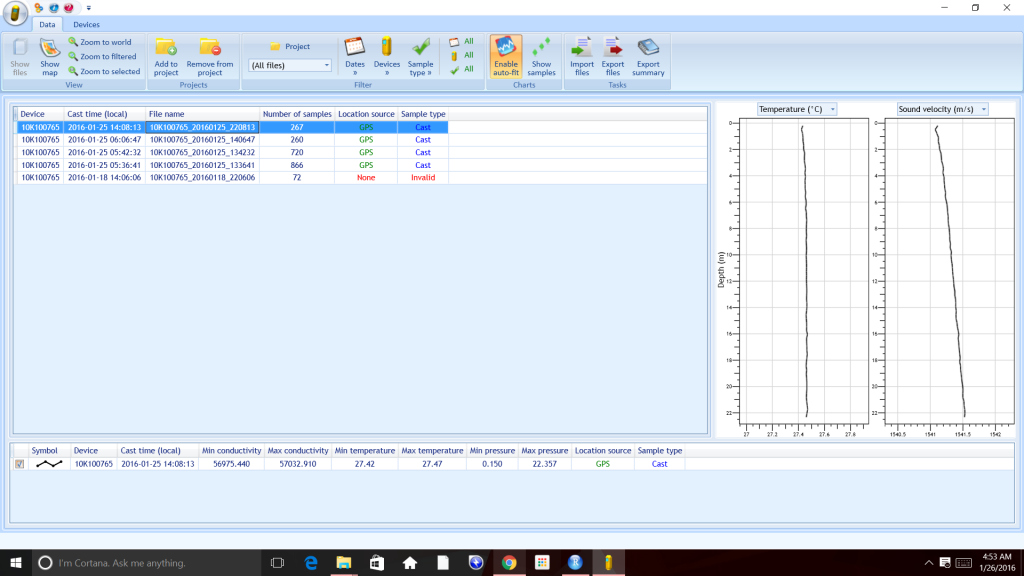
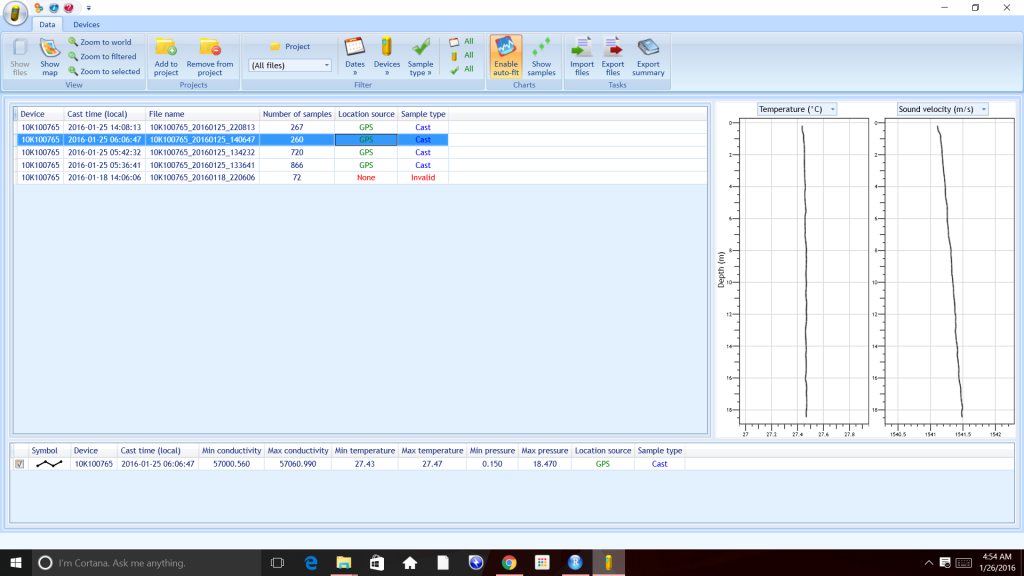
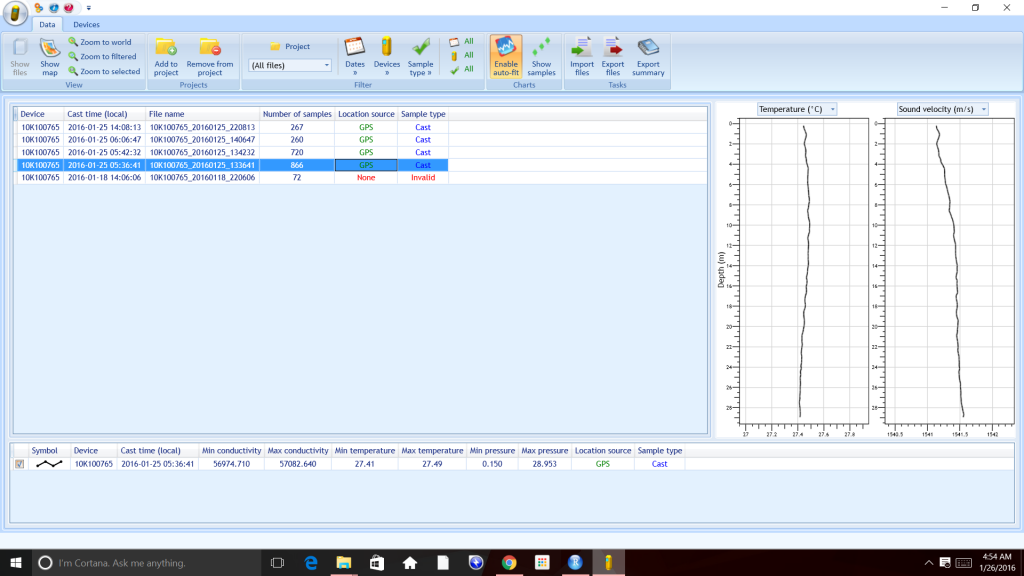
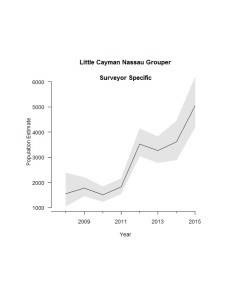
Students from the Renaissance School of Art and Reasoning in Sammamish, Washington inquired yesterday about the graphs Grouper Moon scientists use to study the fish count data. Below are a few graphs sent to me by Lynn Waterhouse, graduate student from the Scripps Oceanic Institute. Can you figure out what these graphs are telling us?